Synchronize panels by clicking the panel directional buttons found at the top of the panel.
InputCalcInd2
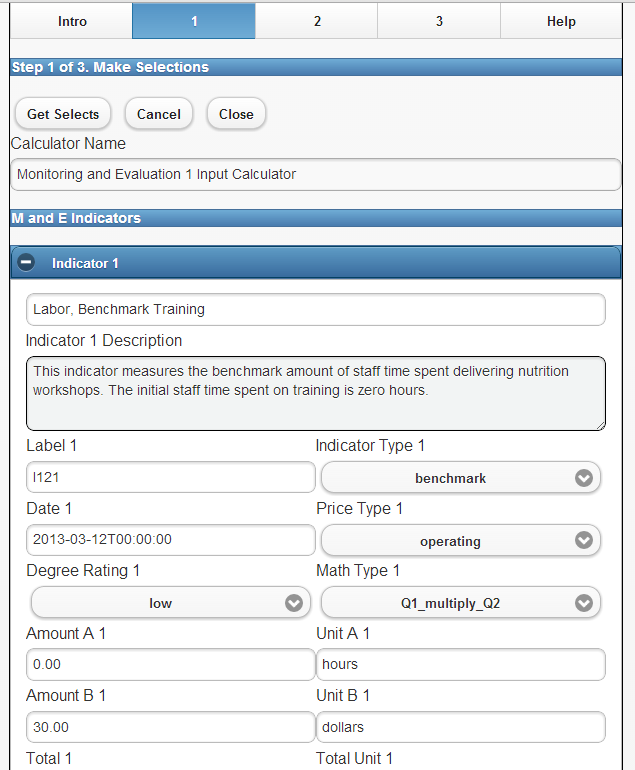
This image shows the properties of M and E calculators.
Tech Story: A- Introduction to Malnutrition Project 1
Page 1 of 4. Introduces the malnutrition improvement project and data set that is used in a DevTreks tutorial.
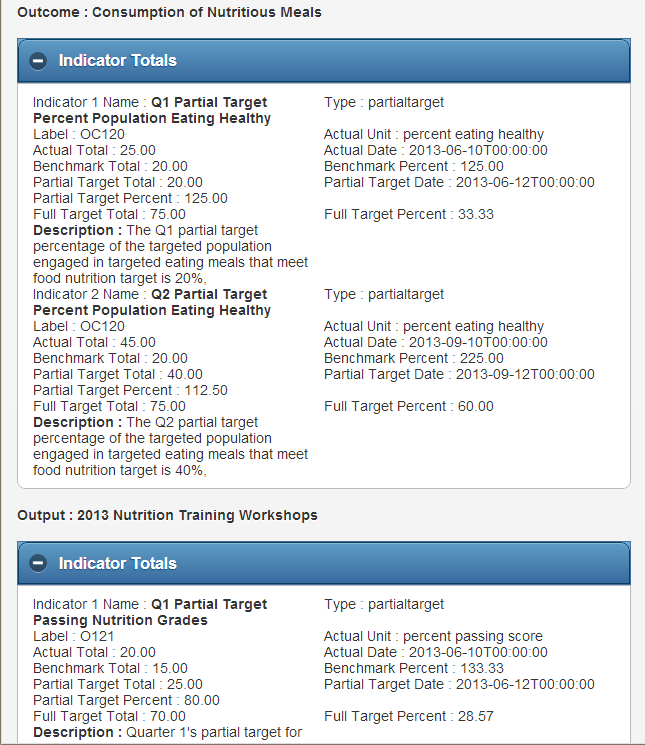
BudgetAnalysisInd1

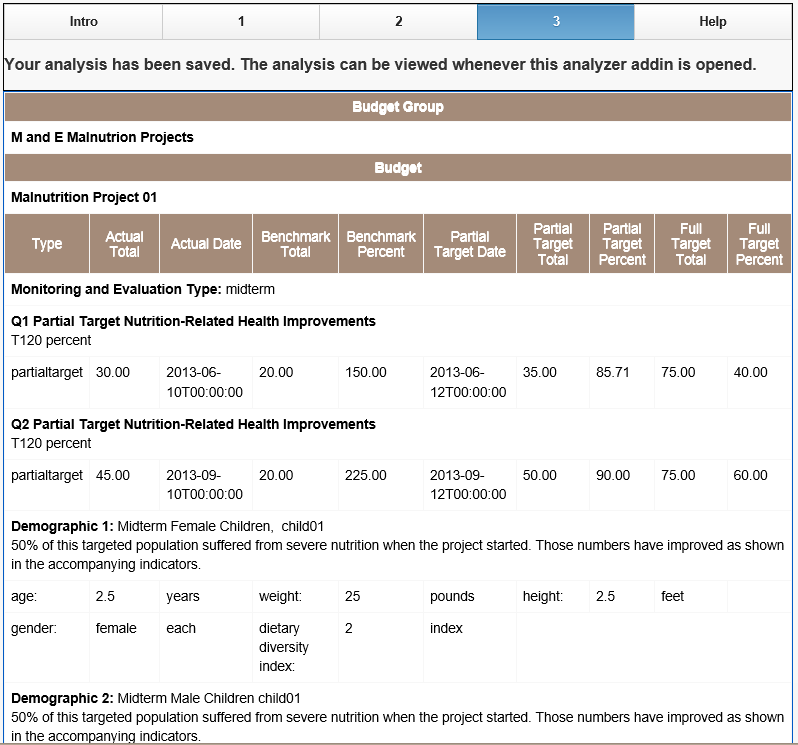
This image displays the results of running a typical monitoring and evaluation analysis.
Tech Story: B- Malnutrition Project 1 Analysis
Page 2 of 4. Explains the current results of the monitoring and evaluation analysis.
Tech Story: C- Malnutrition Project 1 Content and Links
Page 3 of 4. Demonstrates the ME element data structures and provides links to the calculations and analyses for each ME element.
BudgetAnalysisInd1
description
Tech Story: D - Story and Summary
Page 4 of 4. Explains how to link stories to content and summarizes the results of the analysis.
ME1BudgetStocks3
This image displays the sibling monitoring and evaluation analyzer.
Dataset:ME1 Change by Id Analyzer
This analyzer measures changes in monitoring and evaluation indicators.
view IRI
ME1BudgetStocks3
This image displays the sibling monitoring and evaluation analyzer.
Dataset:ME1 Progress Analyzer
This analyzer measures the earned value of achieving target levels of monitoring and evaluation indicators.
view IRI
ME1BudgetStocks3
This image displays the sibling monitoring and evaluation analyzer.
Dataset:ME1 Stats Analyzer
This analyzer measures progress towards achieving target levels of monitoring and evaluation indicators.
view IRI
TotalandMarginalProduct
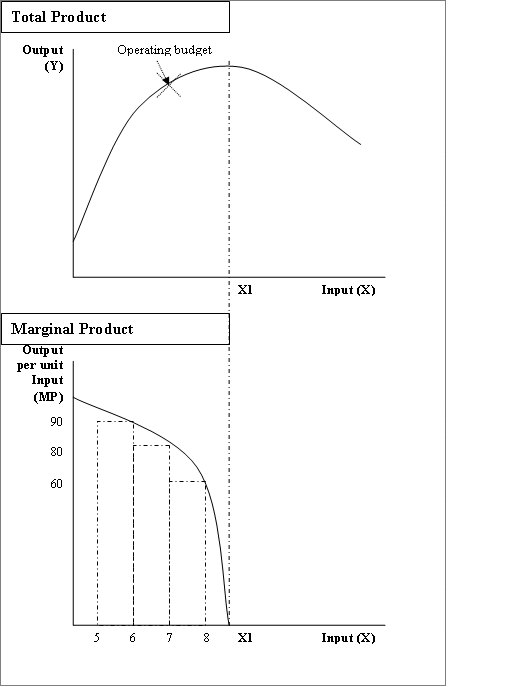
This image displays one of the economic principles underlying budget analysis.
Dataset:NPV Operating Budget Calculator
This calculator carries out net present value calculations for operating budgets.
view IRI